Inside SentiOne
 on
on
19 Mar 2018
Social media all week long! New feature in SentiOne – Week Histogram!
on

You can check not only the rush hours for online conversations you want to monitor in our tool, but now also top days for your configured projects. Thanks to hour and week histograms, you can learn when the Internet users are the most engaged in discussions on a chosen topic. What can be read from the charts?
Thanks to the new feature in SentiOne – Week Histogram – we checked what people share online each day of the week. Assuming that what we write about in the web mirrors our real life, here is how the week of an average person could look like these days:
Monday – I need to get some sleep!
Do you know this beautiful feeling when the alarm clock rings in the middle of a blissful dream, but you calmly turn it off because today is free and you can sleep as long as you want? Well, not this time. It’s Monday and… I think you know what that means. Time to work!
How to survive a Monday? Of course, you’ll need some extra power boost – that’s why we usually write about coffee and redbull on Mondays.
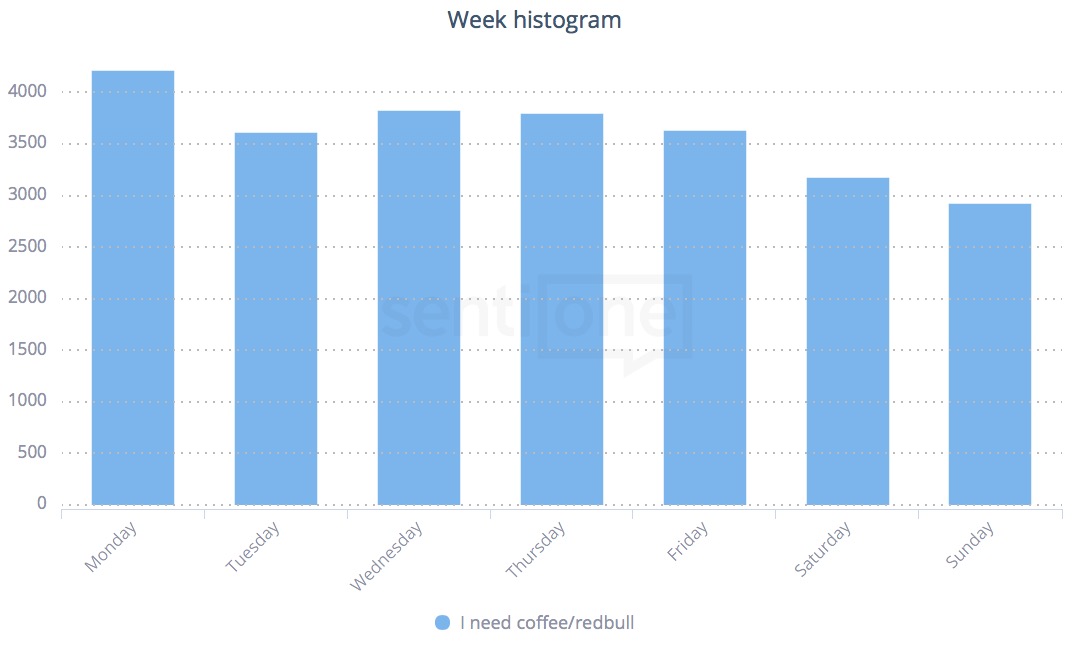
Weekly histogram for the topic “I need coffee/redbull”. Research period – last 12 months
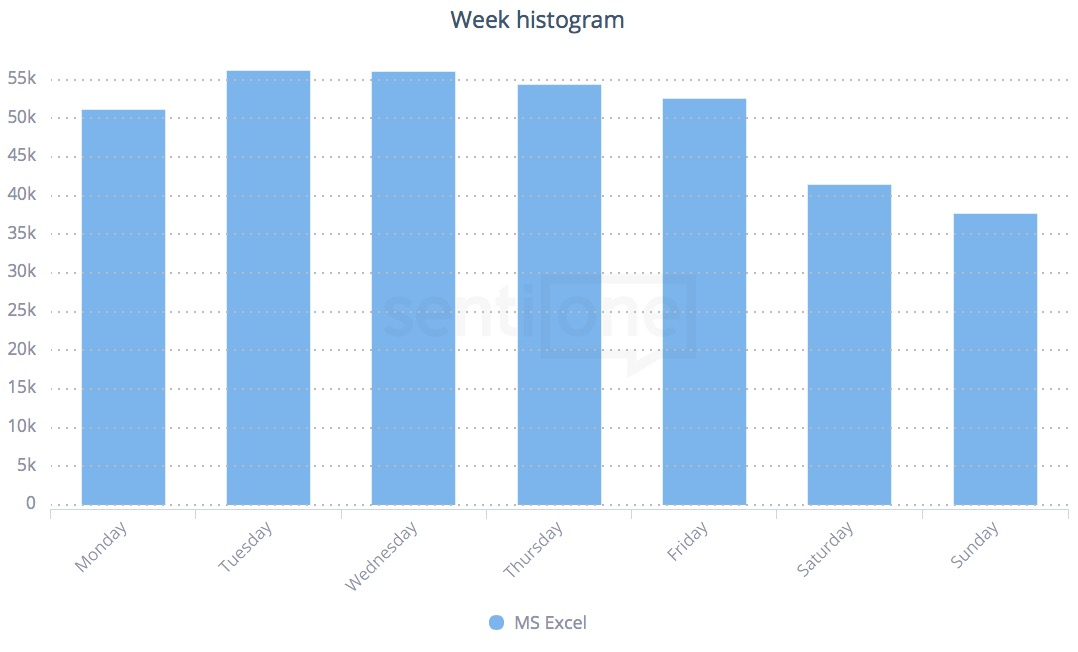
Tuesday & Wednesday – work, work, work!
You can’t fool your destiny – after a few coffees and a sleepy Monday, we need to actually do something. Or at least pretend by moving some cells and highlighting some rows. What is not surprising, on working days we talk much more often than usual about MS Excel. Mostly on Tuesdays and Wednesdays.
Thursday = Cheatday
Diet starts on Monday! No more junk food! Only fit and healthy, right?
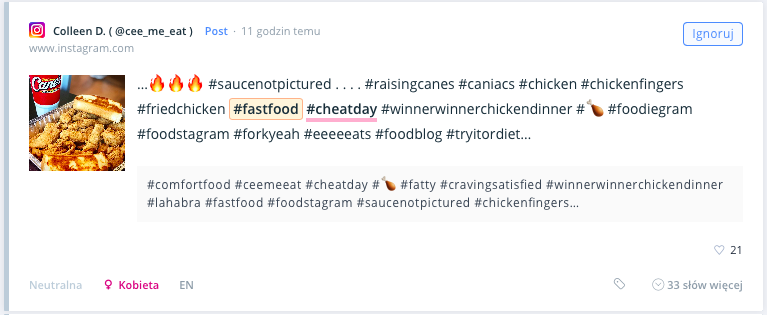
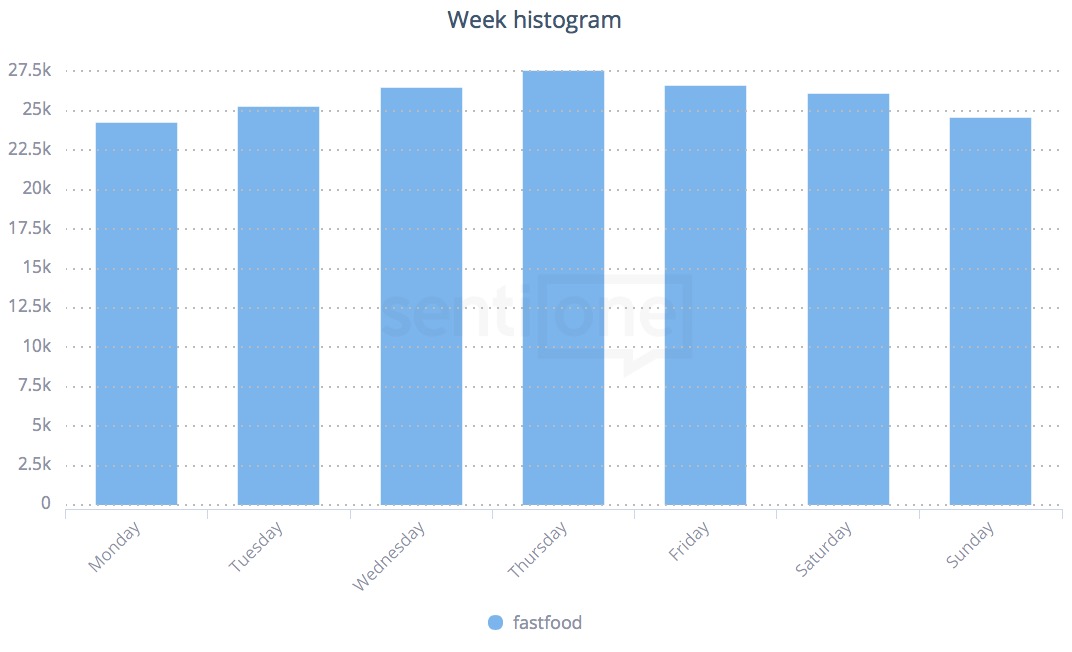
Have you been there? How long did your diet last? Well, looking at the intensity of discussions about fast food, we can assume that most of us get the strength to thrive in this resolution as long as… until Thursday. Then we write about unhealthy food, usually uploading photos of what we’re currently eating. Very often the Thursday photos are accompanied by #cheatday.
But from Monday… I’m on a diet! This time for real.
Weekend? Party time!
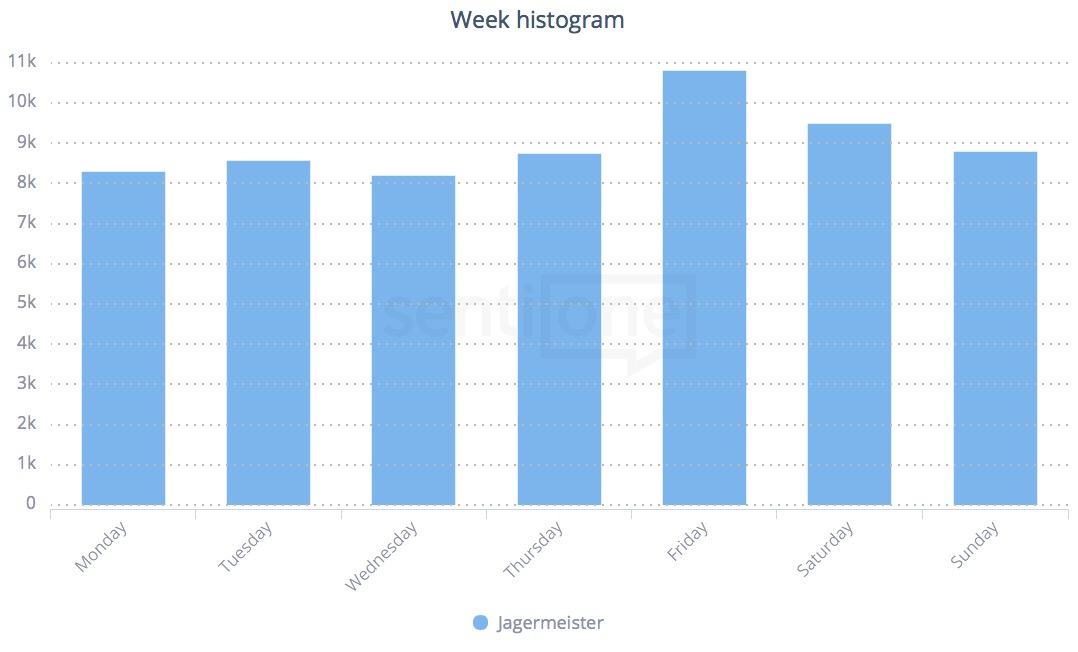
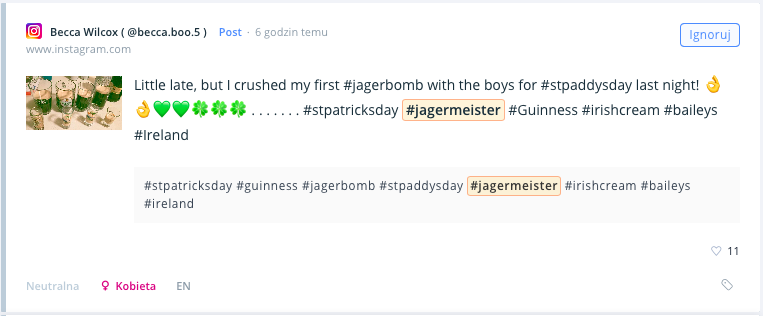
It’s not a surprise that Friday and Saturday are connected with some refreshments. Take a look at one of the top alcohol brands’ results – Jagermeister:
Sunday – the unbearable sound of growing grass
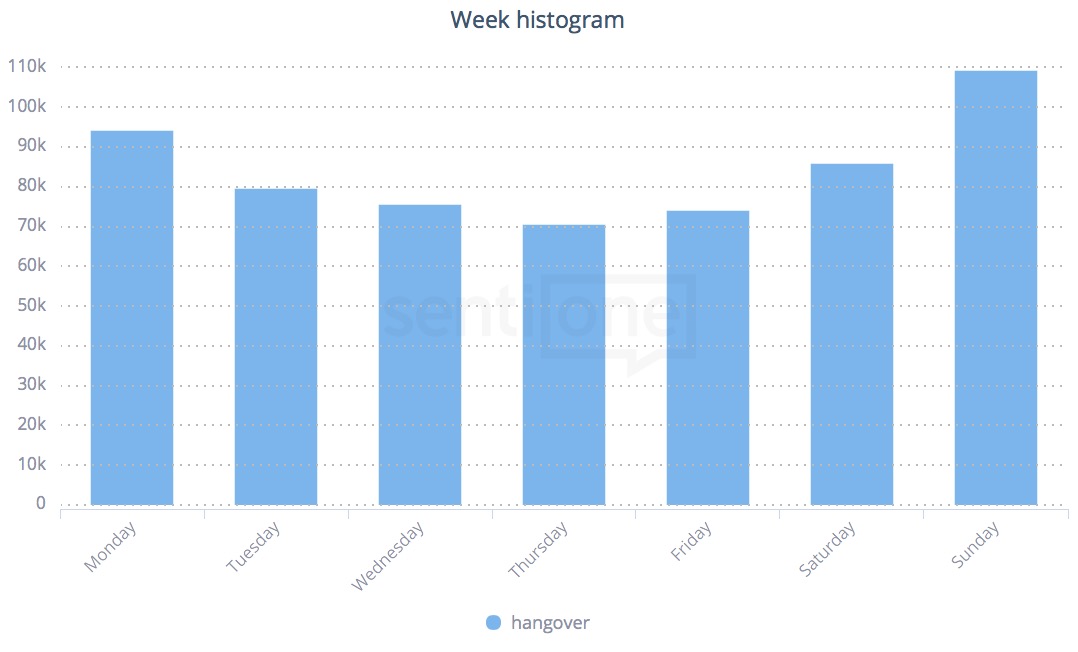
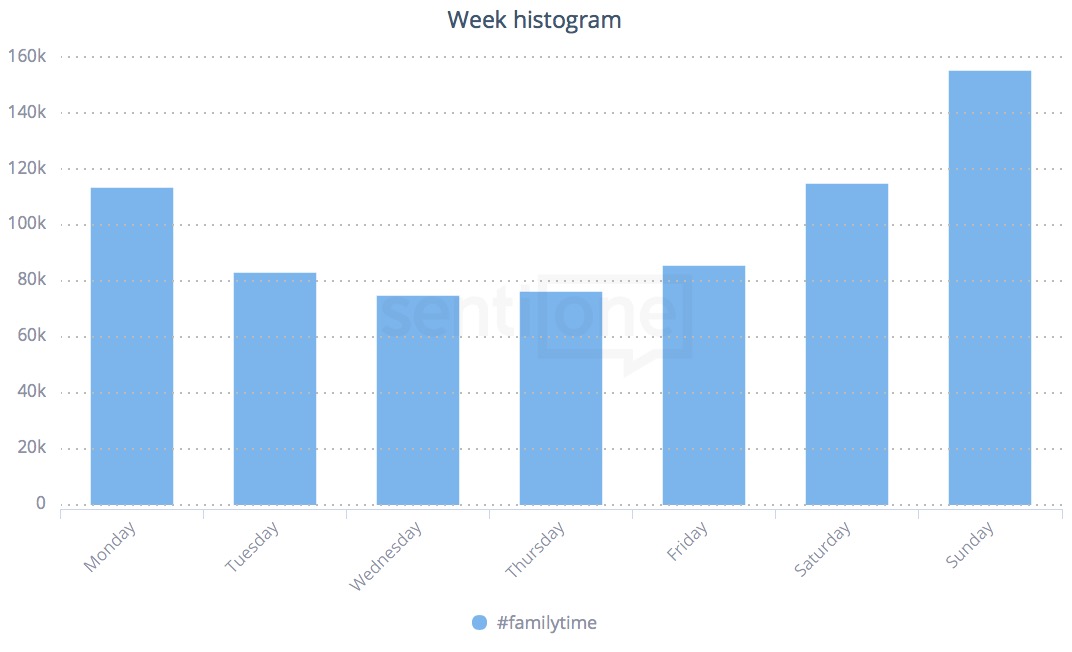
Easy like a Sunday morning? Well, this correlation of Saturday’s and Sunday’s topics probably do not need further explanation ? What’s interesting, we write about hangover also on Mondays… bad memories after the weekend? Still reminiscing the walk of shame? Did you forget the tea at granny’s? Hope not, because Sunday is also a…
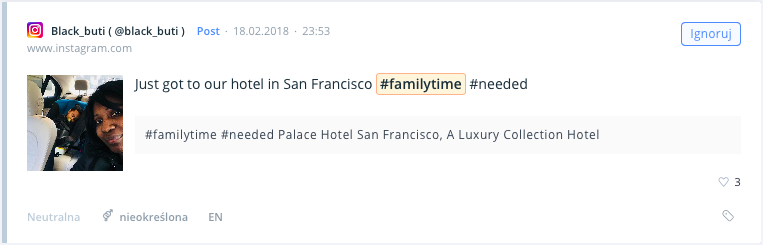
#familytime!
Naturally, the overview of the week presented above is only a source of curiosities that we should take with a pinch of salt. It is enough, however, to adjust the subject for business needs – enter the name of your brand or industry and find out which days are best to address personalised communication to internet users discussing your topics.
Keeping in mind the examples above, Monday would naturally be the best day for advertising coffee or energy drinks… at what time? To which target group? In what kind of manner? You’ll find all the answers in SentiOne, of course!
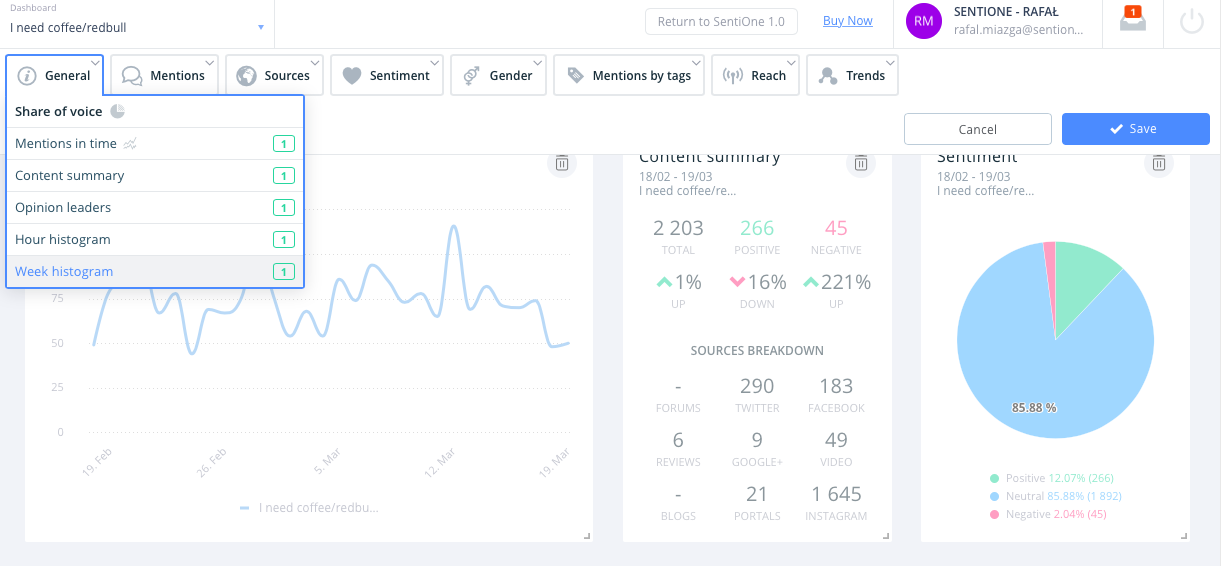
How to create a Week Histogram in your SentiOne panel?
The week histogram is one of the recent features in the system, available in all SentiOne packages. As hour histogram, it is primarily addressed to interactive agencies, media houses and network communication specialists. The analysis of the most attractive days and hours for the brand or industry gives a wide range of possibilities to new media analysts and sociologists as well.
You can create a chart with a weekly histogram for each of your projects in the Dashboard section by selecting “Customize” and adding it in the “General” menu.