Listen Product News
 on
on
07 Aug 2020
Top 5 features of the SentiOne social listening tool you may have missed!
on

Online monitoring tools will be useful now more than ever. Ever since consumers moved from offline to online, here at SentiOne we have recorded more and more online discussions, tracked more mentions and aggregated more data to present you even more consumer insights. The global pandemic, financial crisis and widespread lockdowns forced consumers to change their usual behaviours.
We swapped our elegant office-appropriate attire for comfy slippers and tracksuit bottoms to #workfromhome; shopping centers reported a 40% decline in footfall as the majority of shoppers chose e-commerce solutions. Cultural events moved to the digital world in forms of livestreamed concerts, virtual galleries and online conferences.
As a result, we spend more time online, consume more media, read more blogs and articles, share more content online and endlessly scroll down through social media pages. What does it mean for you, the digital marketeer? Look for more tips and tricks to make the most out of this shift to the online world..
If you are new to the world of online monitoring, please start by reading our social monitoring 101 guide or this case study about improving brand awareness. These are great entry points to get you familiar with the concept of online listening, analysing online behaviour and looking for trends and insights.
If you’re already familiar with the intricacies of social listening, we’d like to present you with a list of top 5 social listening features you might have missed in SentiOne! Some of them are brand new – based on our proprietary AI algorithm – whilesome are good old useful features that you should be using on a daily basis!
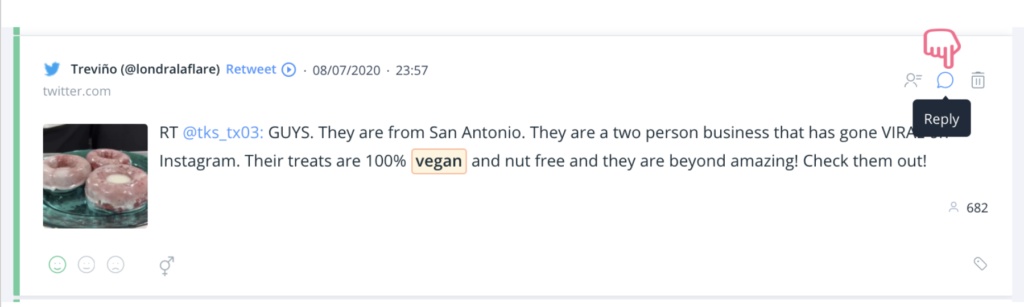
#1 Simple Reply – the easy way to connect with your audience
Have you noticed the little icon next to mentions in the list? This is the new Simple Reply feature! From now on, whenever you see a mention that you should address – just click the icon and reply! It’s very intuitive and will not take you out of the page you were on. Once you finish replying to the mention, the tool will simply take you back to the list of mentions you were browsing previously. Simple Reply allows you to stay close to your audience, react to their concerns and engage in discussions – without investing your $$$ and time in a separate social media customer service tool!
Recommended use:
Social media never sleeps – you should manage it regularly. Every once in a while check all the posts and comments mentioning your company. Look for the ones that need your attention: product questions, customer feedback, pre-sales questions, product reviews, etc. That is the easiest way to stay close to your customers, build an engaged community and also… collect some sales leads!
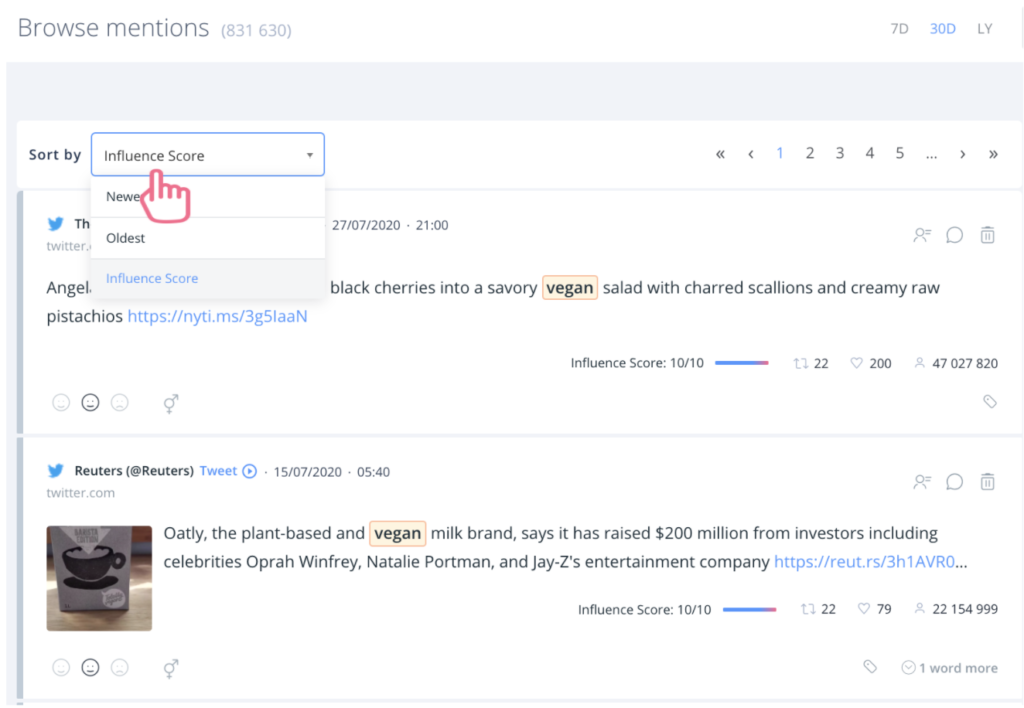
#2 Filter by influence score – no more scrolling through all the data!
If you are monitoring the internet for a popular brand, viral campaign or a social subject that is currently trending (have you ever tried searching for coronavirus keywords?), you will most likely face a wall of endless mentions. We get it, not everyone has all the time in the world to read through every online discussion! That is why we have implemented a new filter in place – influence score! By selecting it, you will see which posts, comments and mentions have the highest reach.
Recommended use:
Use an influence score filter whenever you want to research a new subject, upcoming trend or particular insight. This way you can quickly grasp what is the preference of the majority of online users. Influence score is also very useful whenever you are dealing with a potential PR crisis situation and you want to find out which comment or post made the most noise about your brand! Another use case? You can also filter by the selected influence score (from 0-10), which allows you to find mentions with medium influence score, in case you are looking for micro influencers!
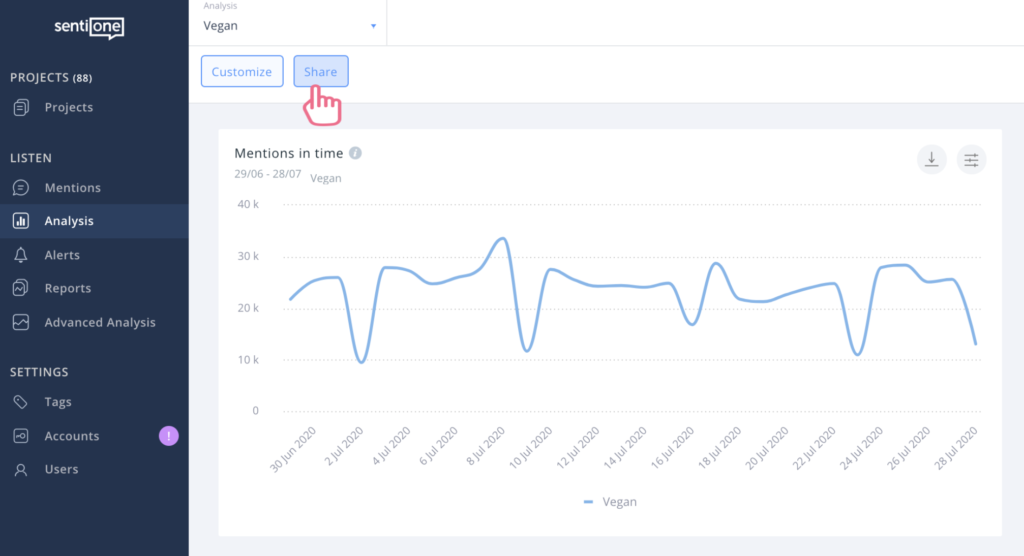
#3 Dashboard Sharing – found an interesting insight? Share it!
This one of those features that caused the “A-ha!” moment in our Product team. Simple to implement, but genius in results! Once you have created your project, you go into the Analysis tab and look for interesting insights. The usual stuff – mentions over time, look for any interesting spikes, read through some top mentions, check out the sentiment analysis… and you found it! You found the one piece of information that will make your manager/client/colleague/agency smile and clap their hands. Simply click at the ‘Dashboard Sharing’ option on the top left corner, copy the link and send it to whoever might be interested! The best part – they don’t need to be SentiOne users in order to access the dashboard!
Recommended use:
This feature is commonly used in marketing agencies, when account managers want to share some insights with their clients. Sharing a simple link to the dashboard will make your email clean and free from attachments that clutter your computer. Also – dashboards are interactive and clickable, so they work much better than usual screenshots!
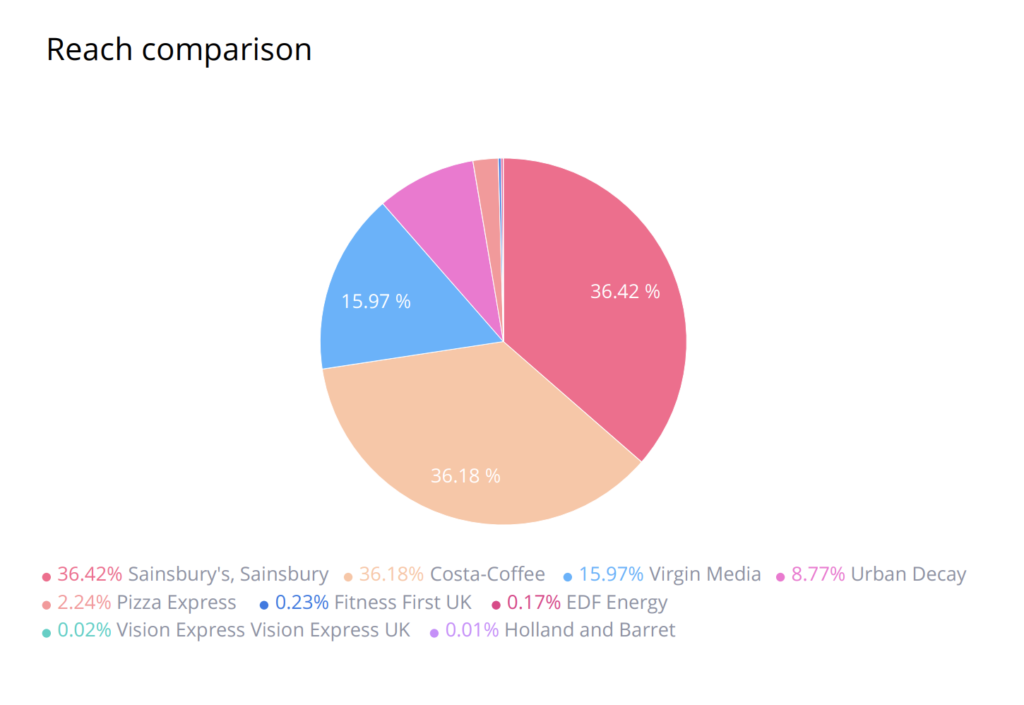
#4 Comparative Report – select a few brands and aggregate the data!
This feature is brilliant if you want to compare two brands or subjects against each other. Are you curious who has higher reach on the market: Apple or Samsung? Who was more popular among women: Trump or Biden? Or maybe you want to check which FMCG brand has the biggest share of positive mentions? Simply go to the Reports section (left side menu) and select Comparative. Then you can choose which projects you want to include in your report! After a few minutes the report will be automatically generated. Open it and enjoy a PDF full of graphics, insights and comparisons! It will allow you to compare various metrics: sentiment share, gender breakdown, reach, and others.
Recommended use:
This feature is commonly used by brand or category managers that would like to compare the performance of various brands in their portfolio. Additionally, it can be used to compare your brands to your closest competition to monitor your market share, consumer preferences and reach of marketing activities. Journalists, bloggers and content managers can use this feature to write interesting articles comparing two or more polarising subjects: presidential candidates, football teams, artists, or popular consumer brands.
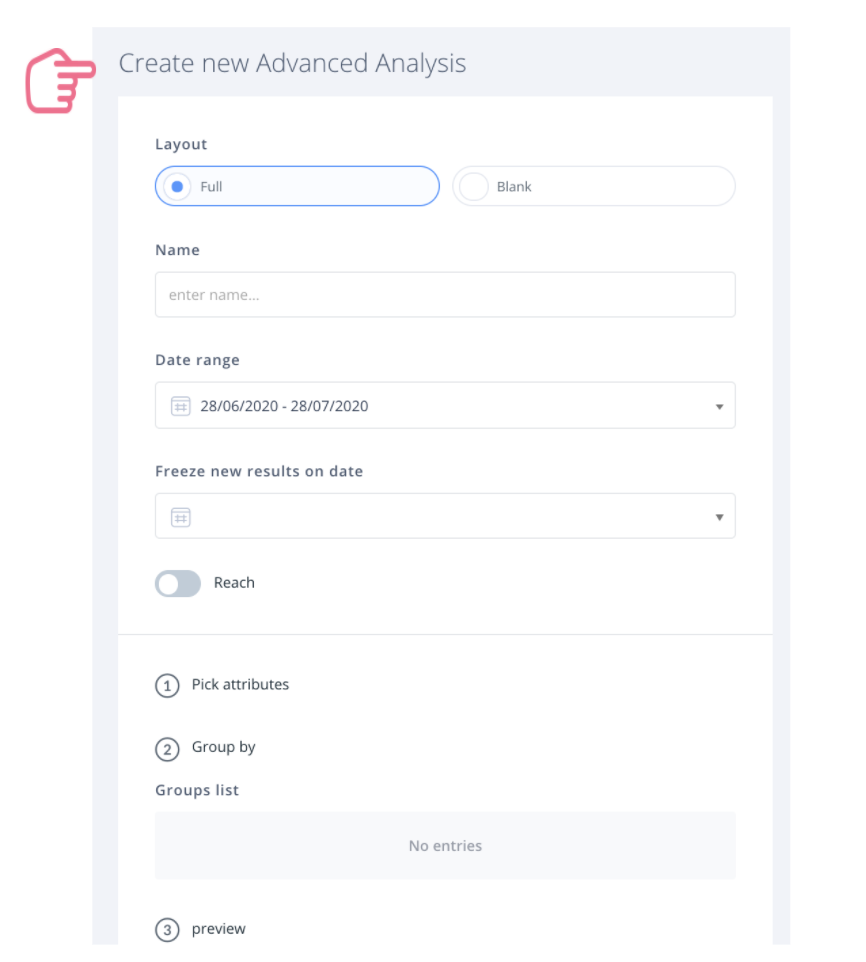
#5 Advanced Analysis – ideal for market researchers!
This feature was created for those who love to dig deeper and look for data that will be a foundation for a longer piece of content – industry reports, market analyses, audits, research. Advanced Analysis allows you to compare and analyse multiple projects. This means that if you manage many projects and you want to get the overview of how they affect each other, you can analyse and categorise them by the monitoring language, type, brand, segment, etc. This way you can get the results of online listening for the entire industry or market. Interested? Read our step-by-step process for Advanced Analysis.
Recommended use:
Market researchers, insight managers, category managers and strategists should be interested in this feature. By aggregating multiple projects (ie all automotive brands) you can get a very detailed and comprehensive view of the entire industry. For a market overview, we recommend to run this analysis on a quarterly basis and share the results with your key stakeholders.
Alright! Now you are fully equipped to browse through online discussions, find relevant insights and make informed decisions in your digital marketing strategy! In case you find any obstacles or a question may pop up – please reach out to our lovely customer service team waiting for you on the chat!