Content Marketing
 on
on
22 Apr 2020
Social media reporting – the what, where, and why (with templates!)
on
As every social media marketer knows, it’s extremely easy to lose yourself in the vast sea of data. Social networks give us access to unprecedented amounts of knowledge and insights. How do you know which information is relevant to the task at hand?
More importantly, how do you explain the results of your work – the success of your campaign, the findings from your analysis – with other people? Once you’re knee-deep in data, losing sight of what’s important. This is where social media reporting comes in.
Why is social media reporting important?
Simply put, social media reporting gathers all of your data, findings, and insights and compiles them into a readable form. This is accomplished by stripping out everything that’s unnecessary and presenting the remaining data in a short, easy-to-read format.
Sometimes, you have to collaborate with marketers or other professionals who may not necessarily be well-versed in social media. Perhaps you need to prove to your boss that yes, your time on Facebook is actually spent on work. Whatever your reasons, it’s always good to have a clear summary of your goals and achievements.
How to get started with social media reporting
The first thing to do is to get your facts straight. What are you trying to accomplish? Which data points and metrics are relevant to your goals? What is the most effective way to present your data and conclusions?
Keep these questions (and, obviously, the answers to them) in your mind as you work through your data. Draw your conclusions and keep your data organised.
The tricky part is presenting your data. A perfect report is immediately readable at a glance while still containing a wealth of information once you look closer.
How to obtain social media data?
All social media platforms allow you to export your own data – that is, data that directly pertains to your account and the content you post. This usually comes in the form of unencrypted JSON files which describe every single one of your posts and comments. Depending on the platform, it may also contain replies to your posts made by other accounts.
Alongside this data, all social platforms also provide you with statistics and analytics describing the performance of your account and its posts, as well as statistical information about your audience and how they engage with your content. Unfortunately, the raw data used to construct these analytics usually isn’t available.
Finding analytics data on social media platforms
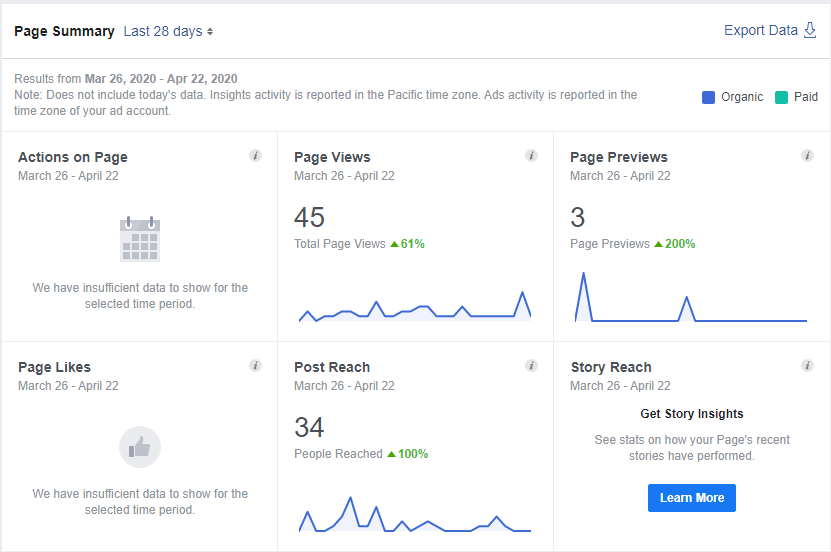
The most important metrics for your social media profiles can easily be accessed on social media platforms themselves. Facebook Pages, for instance, have an Insights tab available – it contains a dashboard full of valuable information about your profile’s performance.
A similar option is available for Facebook Groups – although the metrics available might be slightly different. Unlike Pages, Groups don’t present demographic information if a given group has less than 250 members.
Twitter has its own analytics platform available to every user – companies and regular people alike! Although hardly exhaustive, it will tell you all you need to know about your profile. It’s only updated once every 24 hours and most data is grouped on a monthly basis.
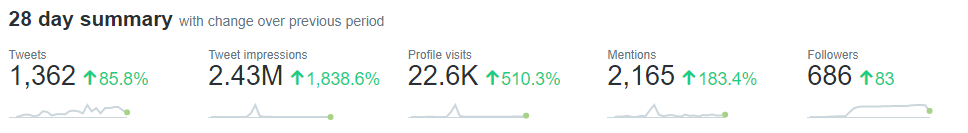
The performance of individual tweets can also be evaluated, although the platform doesn’t go into much detail when it comes to details such as demographics.
Other platforms also offer varying degrees of analytics to its users – but if we wanted to examine all of them, we’d be here all day.
Making your life easier with social listening
As you can see, obtaining data from individual social media platforms is easy. Combining and making sense of data from several services simultaneously, however, can be a major challenge. This is where social listening tools, such as SentiOne, come in.
By cooperating with every platform provider, social media management tools can directly access each service’s API – the programming interface through which raw data can be accessed. This gives them much more flexibility and power – sometimes, they can even access data that isn’t shown on the built-in analytics panel!
What’s more, these tools have already done the hard work of figuring out how to easily combine data from all sorts of different social media platforms. That means all you have to do is link your account to the application – and everything just works.
Although performing analysis on raw data by hand is technically possible, we can’t recommend doing it when even the most rudimentary social media management tools speed up the process significantly.
How to present your findings
Obviously, no two reports will ever be the same. Depending on your kind of analysis – and your target audience – the data might require a different approach.
Detailed analysis and findings which need to be explained at length benefit from a written report. In this case, make sure you run your document through an actual human editor. You want your audience to understand your conclusions without having to work through a wall of text!
Comparison-style analyses, such as competitor analysis, benefit from a more graphical approach. A slideshow may be the best approach – as long as your co-workers don’t consider PowerPoint to be an implement of torture. For the more sensitive among us, plenty of online tools, such as Canva, allow you to create graphically appealing reports filled with graphs and pie charts – even if you’re not a graphic designer.
If you’re using any sort of modern social media monitoring tool, you might already have superb reporting capabilities available to you. Explore your toolkit and check if your software can save you the trouble!
The various types of social media analysis
As mentioned previously, there are a lot of different types of social media analysis. The form your report takes depends heavily on your particular use case.
An easy way to figure out the precise form your report will take is to ask yourself a simple question – who is my report aimed at?
Below is a smattering of examples of social media reports and the people they are likely aimed at. Feel free to use these to guide you on your reporting adventure.
Social media manager – the monthly report
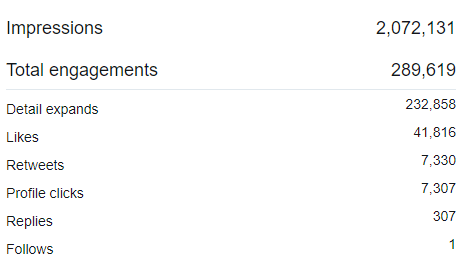
This type of report focuses on a summarised performance of the brand’s social media channels – their performance and engagement. The most important questions to answer are how many people have interacted with our profiles? Did our audience grow? Which content performed the best? Focus on answering these and related questions.
Insights from social media listening are key in this type of report. Since social listening tells you which types of content resonate well with your audience segments, make sure that data is presented in your report – after all, it’s invaluable in creating an effective marketing strategy.
Key metrics to track:
- Reach
- Engagement
- Leads acquired
- Best performing posts
- Audience growth
Brand manager – market overview and competitor overview
Brand managers are less concerned with the detailed performance of individual posts – they’re all about the big picture. How does your brand stack up against its contemporaries? Are users talking about your company? If so – what’s their tone of voice? Do you dominate discussions in your field? Answer these questions to satisfy even the most demanding brand manager.
Just like social media managers, brand managers find insights from social media listening incredibly useful. Ensure that your findings about your audience segments, the tone of their mentions of your brand, et cetera are in your report.
Key metrics to track:
- Reach across all channels
- Reach across owned channels
- Brand sentiment
- Share of voice
- Engagement
PR manager – word of mouth reports
PR managers are interested in the way your brand is perceived by the proverbial “man on the street” – someone with no stake or previous contact with your brand. As such, they aren’t interested in data that comes from your own profiles – it’s safe to assume that everyone who likes it is either already interested in your products/services or has already made a purchase. PR managers like to see data such as organic mentions and media coverage.
Social listening data also comes in useful here. Organic mentions, after all, can only be captured through social listening tools. Don’t spare any details – make sure your PR manager knows where your brand is discussed and in what words.
Key metrics to track:
- Organic mentions
- Sentiment
- Share of voice
- Media coverage
- Media authority
Executive report – online presence overview and competitors comparison
Executives usually aren’t concerned with the minute details. They usually like to see a top-level overview of your brand’s social media presence. As such, don’t bother with the nitty-gritty. Focus on the big picture and present a comparison with your competitors as context.
As an aside, executives usually have to compare the performance of different departments within a company. As such, ensure that your company has a uniform report presentation style – it’s much easier to read a lot of reports if you don’t have to adjust to different graphical styles every five minutes!
Key metrics to track:
- Online reach (combined and broken down by channel)
- Top markets
- Share of voice (compared with competitors)
- Key social media events (important campaigns or crises)
Client report – for social media management agencies
Sometimes, brands outsource all of their social media activity to independent agencies. Clients do so often because they don’t have the expertise or the resources to handle their profiles on their own. In this case, it is important to find a balance between the amount of data you present to them and their ability to perceive its value. Don’t overwhelm them with too many details and make sure they understand and are satisfied with the results.
Key metrics to track:
- Social media reach
- Organic mentions
- Number of leads acquired
- Best performing posts
- Engagement
Social customer care report
In other cases, brands might wish to offer customer service through social media. This is almost ubiquitous these days – after all, it is the most convenient way to reach a brand. This, too, is commonly outsourced to external entities. If you find yourself on the receiving end of such an outsourcing, here’s what you need to focus on.
Key metrics to track:
- Response rate and time
- Communication channel breakdown
- Commonly raised topics (broken down and sorted by channel)
- Total servicing time
The step-by-step process behind social media reporting
- Establish your goals
- Pick out the relevant data points
- Gather the necessary information
- Pick out an appropriate presentation method
- Ensure your report is readable
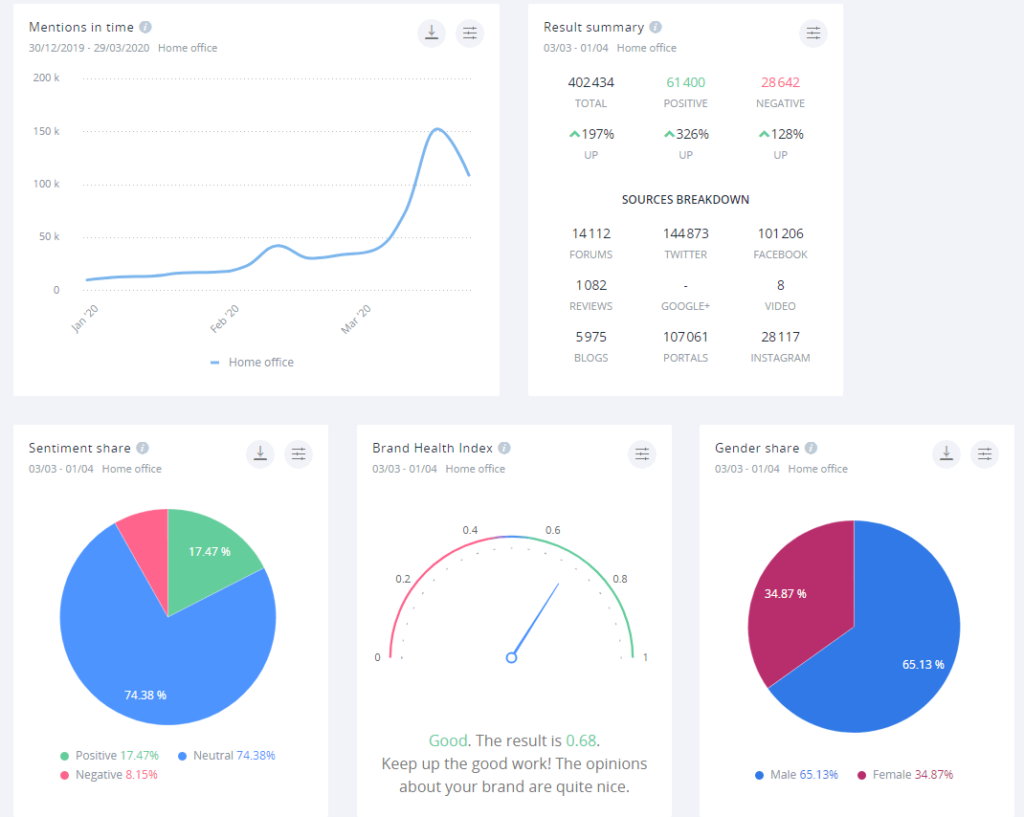
Report templates
Coming up with attractive designs for your reports can be a challenging task. Don’t worry – as usual, we have your back. Here’s a sample report generated by SentiOne – you can freely use it as a starting point for your report.