
As the summer draws to a close, we at SentiOne are excited to share what we’ve been working on in the third quarter of 2023. Our mission remains to empower you with insights that enhance your ability to make data-driven decisions. This quarterly product update will walk you through the latest improvements and features to help you achieve your Q4 goals.
Table of contents:
- SentiOne x ChatGPT updates
- Crisis Monitoring: Minute-by-Minute Insights
- New Feature: Engagement Rate Over Time
- Updates in Reports
- New Metric: Tweet’s Views
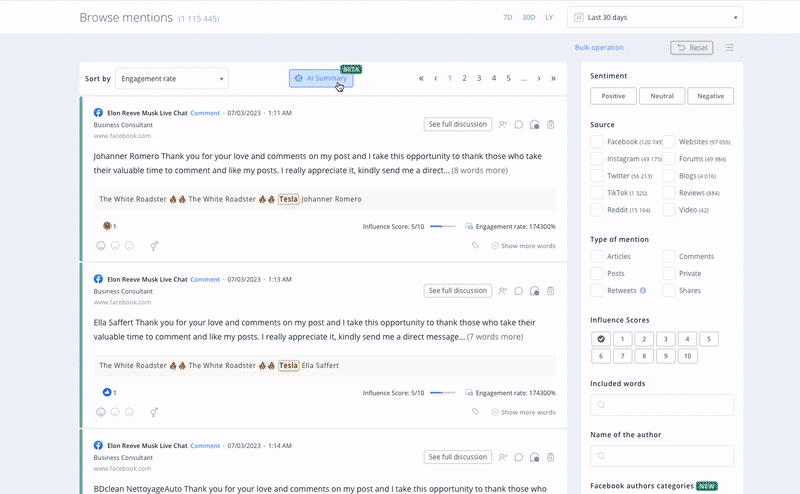
SentiOne x ChatGPT updates
Great news, our valued SentiOne x ChatGPT BETA testers. We’ve raised the bar when it comes to AI summary capabilities. We’ve got some fantastic additions that you’re sure to appreciate.
Here’s what’s new:
- Deeper analysis: You can now analyze not only 150-250 mentions but an impressive 300-400 of the most influential results within a single AI summary.
- AI Prompts: You can take control of your AI analysis by choosing from various prepared prompts. If you’re seeking even more influence, why not craft your own questions using the customized option?
- Event description: Delve deeper into the most significant events within your chosen time frame with the AI summary in Insights’ Peaks analysis. We’ll provide detailed descriptions of these events, so you’ll need to dissect charts and mentions on your own.
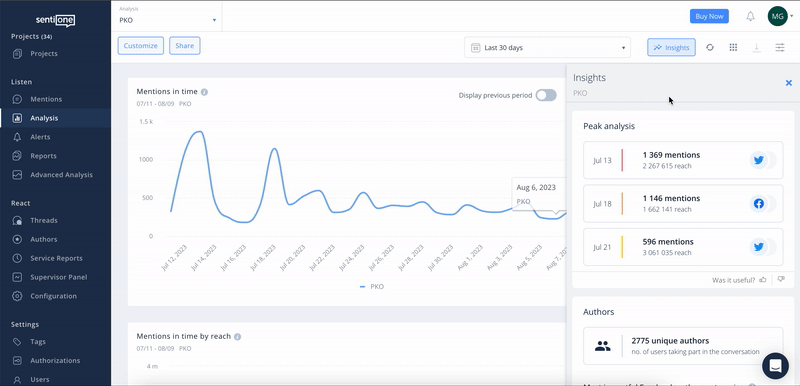
- AI summary: Experience the convenience of AI summary availability for the “(…) in time” charts within the Analysis module. Now, when navigating through Analysis and requiring a summary for a specific peak or time range, you no longer need to switch to the Mentions module to access the AI summary.
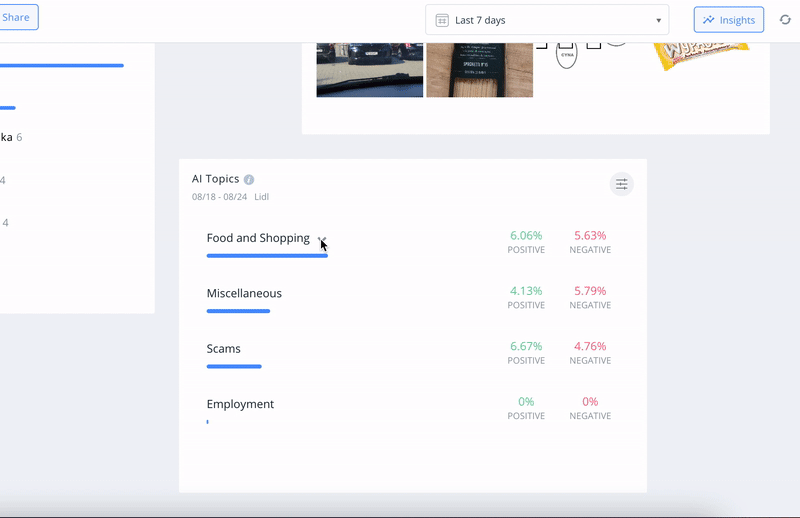
- AI Topics: The AI Topics widget is here to help you find the most discussed themes among mentions in your projects. AI Topics groups result into common themes and show the five most frequently appearing ones. You can check the ratios of positive and negative mentions, read the summary of each topic, and, if you’re more curious, also read the mentions related to the chosen topic.
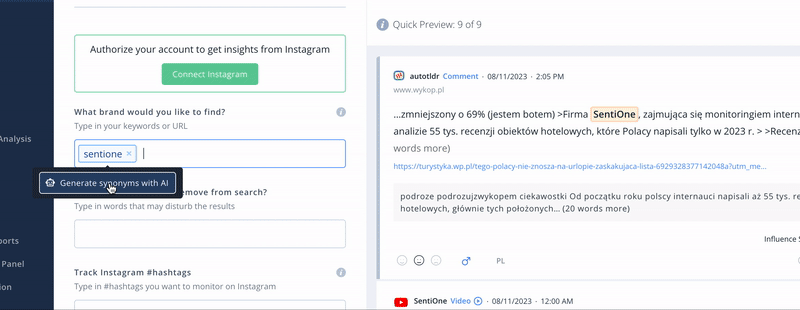
- Synonyms: Now, you can effortlessly generate synonyms for your keywords. We’ve introduced this feature to simplify the process of query creation, making it more convenient for you.
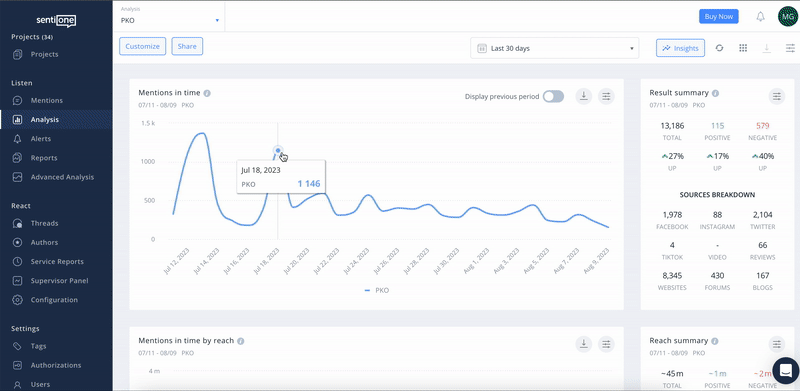
Crisis Monitoring: Minute-by-Minute Insights
When it comes to crisis monitoring, precision is key. Now, you can track how mentions unfold minute by minute, allowing you to stay on top of rapidly evolving discussions.
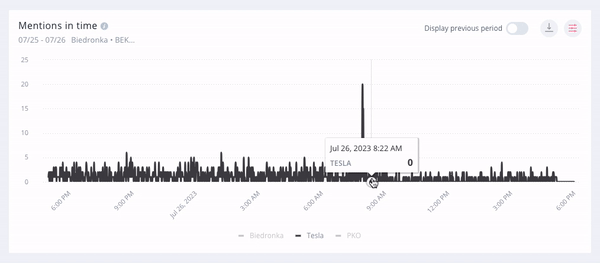
👀 Where to find it? Go to the Analysis module and select any analysis dashboard 👉 open filters (click the proper icon in the upper right corner of any “in time” widget) find granulation, choose minute, and apply your changes.
New Feature: Engagement Rate Over Time
With our newest widget, managing and monitoring the average Engagement Rate throughout your chosen time frame is now a breeze. We’ve developed the Engagement Rate Over Time widget to put you firmly in the driver’s seat of your social media performance analysis.
Using this widget, you can now:
- Determine whether your overall Engagement Rate trend over time is positive.
- Pinpoint the exact days when the average Engagement Rate reached its peak.
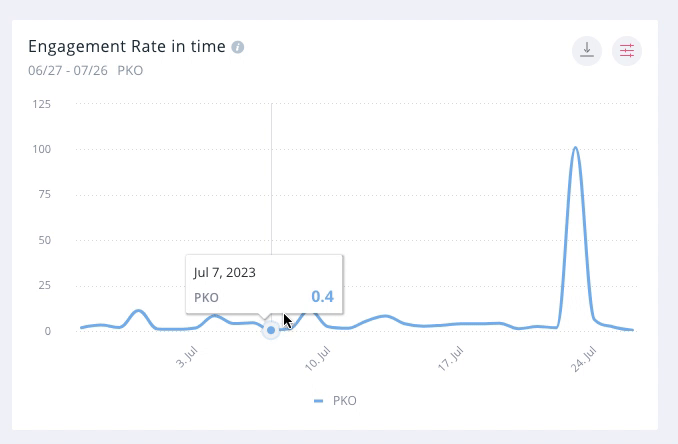
👀 Where to find it? Go to the Analysis module and select any analysis dashboard 👉 click Customize in the upper left corner 👉 find the Engagement tab, and hover your mouse over time 👉 select Engagement Rate in time, and voila!
Updates in Reports
Gender analysis in Comparative report
You can now check how many people talking online about your brand are women and men and compare these results to your competitors’ audiences.
Peaks Analysis available in Reports
We’ve heard your requests loud and clear and are thrilled to fulfill them.
In your Brand Awareness report, we’ve dedicated a whole page to Peaks Analysis, positioned right after the “How much is your brand discussed online?” section. This addition streamlines your reporting, saving you the hassle of manual edits. With Peaks Analysis, you’ll have more actionable insights, and PDF/PPTX reports are now effortlessly ready to go.
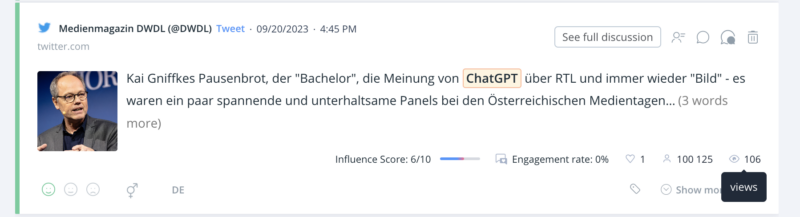
New Metric: Tweet’s Views
Now, you have the power to discover the exact number of times a particular Tweet has been viewed.
This metric is accessible for each Post (which is what Tweets are now referred to), and the data is sourced directly from X (formerly Twitter), ensuring the highest accuracy possible.
In conclusion, we’ve covered an array of exciting developments in our Q3 2023 product summary. From the evolution of ChatGPT to the introduction of fresh features and metrics, we’re dedicated to continuously improving our tools to empower your data-driven decisions. Stay tuned for more updates, and don’t hesitate to reach out if you have any questions or need assistance making the most of these new features. Thank you for being part of our journey, and here’s to a future filled with data-driven successes.