If your account consists of more than one topic, you may at some point want to see the generated data together – you can achieve that through creating a comparative dashboard. There is also a way to compare the acquired data off-line with people who are not using SentiOne – multi-topic reports.
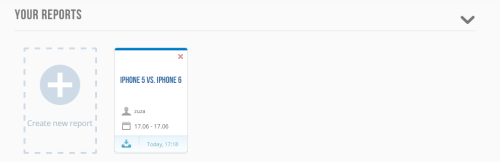
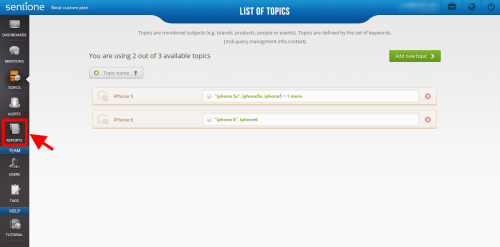
How to make the most of your data with reports covering various topics? Simply start creating one! Go to the “Reports” section in SentiOne and click the “Create new report” button.
Creating a report
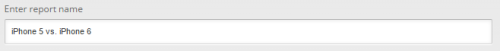
You start the report setup by providing a title for it – you can either provide a custom name or leave the default name – “Internet monitoring report”. You can also upload your logo to the report – if you don’t do so, SentiOne logo will appear as a default.
The next thing you have to do is choosing the main topic for the report. The “main topic” is the topic that will be always summarized first in the report. If you only want to see data for two topics compared, leave this field blank.
You can choose your report to be a “Press release summary” – in that case only blog posts and articles will be considered in the report.
![]()
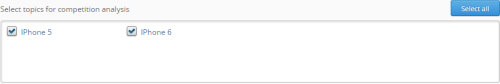
Then you choose the topics you want to have included in the report. Topics chosen in this section will not be compared, but shown as two separate summaries. If you would have chosen “iPhone 5″ as your main topic and then chosen “iPhone 5″ and “iPhone 6″ in the “Select topics for the report” box, data for “iPhone 5″ topic will be shown twice.
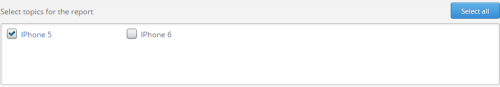
If you want to compare your competitors, this is where you choose the topics covering them to be compared – the amount of topics for comparison is not limited, so you can compare all of your topics. Remember that the more topics you choose, the more data they require – this will influence the speed of report generating.
Next step is aimed at setting up the time coverage for the report. You can either choose a general time range (today, yesterday, last week, last month, last 3 months, last 6 months, last year – depending on your SentiOne plan) or choose specific dates to be covered.
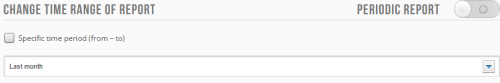
You can also choose to create a periodic report.
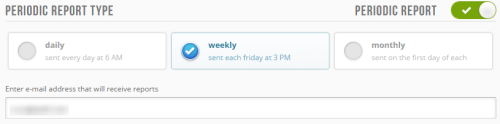
In this case, a report will be created after an exact time range has passed. You can also set up a list of recipients for the periodic report.
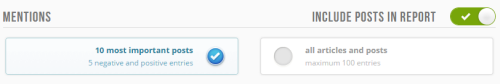
Your report can contain mentions acquired by SentiOne – decide if you want to have 10 most important posts or all of them (up to 100 results). You can also exclude the posts from your report.
The last step in creating your report is the commentary. It’s an optional feature that allows you to comment on the data, most important tendencies or the events that might have caused changes in the regular mentions amount or sentiment – product launches that caused mentions peaks, communication crisises that resulted in higher number of negative posts or a successful event that caused an unusually positive sentiment of all mentions. Your comment will be shown on the last page of the report and has no characters limit.
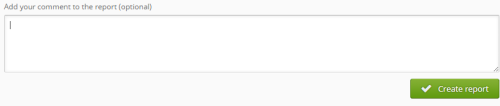
After clicking the “Create report” button, you will be brought back to the “Reports” section and you will see the report pending. After it’s done, you will see a notification in the lower right corner and your report will be available for download as a PDF file.